Cart size, otherwise known as average order value (AOV), for wholesale cannabis transactions varies significantly across markets and over time due to specific market conditions, regulations, and product popularity.
To gain additional perspective on consumer trends, we analyzed AOV alongside product category market share and pricing
Average Order Value in 2022
Between Jan. 1 and April 4 of this year, overall AOV in LeafLink was $3,750 across the nine markets—less than in
Even while average order value decreased, the total number of orders increased. Total orders per month across these nine markets grew by 35.7% from 2020 to 2021 and 15.6% in 2022 due to a combination of additional buyers using LeafLink and increased purchase frequency.
When analyzing market-level data, there are clear distinctions between buyer behavior and a lot of variance across these markets.
2022 AOV and Most Popular Categories By Market
| Market | #1 Category | #2 Category | #3 Category | |
| MI | $7,596 | Flower | Cartridges | Concentrates |
| NV | $7,007 | Cartridges | Flower | Edibles & Ingestibles |
| AZ | $6,154 | Cartridges | Edibles & Ingestibles | Flower |
| CA | $3,544 | Flower | Pre-Rolls | Cartridges |
| AK | $3,081 | Flower | Cartridges | Edibles & Ingestibles |
| WA | $1,987 | Flower | Edibles & Ingestibles | Concentrates |
| CO | $1,834 | Cartridges | Concentrates | Edibles & Ingestibles |
| OR | $1,531 | Flower | Cartridges | Edibles & Ingestibles |
| OK | $1,014 | Edibles & Ingestibles | Cartridges | Flower |
Categories are ranked by their percentage of transaction volume in LeafLink. MI, NV, and AZ see the
When considering market maturity within the AOV hierarchy, we can see a trend: States that were first to legalize adult-use cannabis generally see AOVs decrease
Price of Flower's Impact on AOV
By comparing flower price changes by year to the average order value, we can see the markets in which flower price fluctuations significantly impact AOV. Correlation ranges from -1 to 1, with a number closer to 1 indicating a strong positive relationship and -1 a strong negative relationship between the two variables. 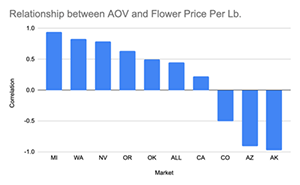
In California, Michigan, Nevada, Oklahoma, Oregon, and Washington, there is a positive relationship between the price of flower and average order volume for buyers, meaning that as price increases or decreases, so does AOV. Arizona, Alaska, and Colorado, in contrast, are negatively correlated, meaning that as prices go up or down, AOV shifts in the opposite direction.
Across all nine markets, there is a somewhat positive relationship (.45) between flower prices and AOV. So what does this mean? As flower prices have decreased over the past few years, so have AOVs on average. Overall, six out of the nine markets showed a positive correlation between AOV and the price of flower.
Each market has its own dynamics, and certain states such as California, Oregon, Washington, and Colorado have experienced above average
In other words, the substitution effect is likely not as strong in these markets. This assumption is an opportunity for further investigation. In a market such as Colorado where flower is not a top category, as flower prices decrease retailers likely see an opportunity to order more — leading to higher AOV.
Alex Feldman is the general manager of Insights & Marketing Services at LeafLink, where he develops products that empower cannabis businesses to make data-driven decisions and grow their reach.

