The importance of tracking key cannabis grow parameters cannot be overstated. Without key environmental and production data, system optimization becomes difficult and subjective as any modification becomes impossible to compare with prior iterations, whether those be fertigation recipes, irrigation rates, or environmental variables.
Data tracking becomes even more critical for growers transitioning from traditional high-pressure sodium (HPS) lighting to LEDs, a decision that impacts nearly every aspect of cannabis production.
“What you don’t monitor, you can’t measure,” says Gretchen Schimelpfenig, technical director of the Resource Innovation Institute (RII), a nonprofit providing crop-optimizing guidance and data for cultivators.
For example, she suggests that “all growers should measure temperature and relative humidity to calculate the vapor pressure deficit (VPD) plants are experiencing in their grow rooms. This ensures growers understand how HVAC and dehumidification systems are performing when lights are on or off and can also help them determine the actual temperature adjustment needed when switching from HPS to LED.”
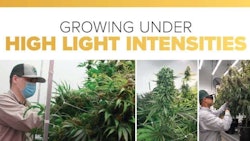
HPS fixtures have long been the industry standard, but more cultivators are turning to LEDs, or light-emitting diodes, for benefits that include increased cost savings and higher light intensity, Schimelpfenig says.
The best lighting and data measurement strategies are intimately linked, she adds. Alongside industry go-tos such as humidity and temperature, growers are wise to gauge CO2 concentration, media pH, root zone temperature and other metrics.
Columbia Care, a multistate operator (MSO) that cultivates, manufactures and sells cannabis products, assesses those key parameters and more, such as wind speed and air circulation, across 1.76 million square feet of growing space at 27 U.S. locations.
Eric Culberson, the company’s vice president of horticulture, says some modifications to Columbia Care’s fertigation strategy were necessary when the company upgraded to LEDs with different spectra and intensity from its previous HPS and plasma technology—changes recognized following rigorous data collection and analysis.
“The difference we see under LEDs is potential for greater swings in pH, EC [electrical conductivity] and moisture when the plants are not getting what they need, when they need it,” Culberson says. Transpiration typically increases in concert with light intensity, or photosynthetic photon flux density (PPFD), pulling more water from fertigation solutions. “This was part of the reason why we began using so many tools and sensors—so we can be in the driver’s seat no matter the light source.”
Because LEDs typically are more powerful than HPS lamps, it’s imperative for growers to calculate both the pH and EC of growing media under newly installed lights, Culberson says. Measuring EC is ideal in determining if plant nutrients are sufficient, with an elevated EC reading implying higher concentrations of fertilizer. (Cultivators encountering high EC in nutrient solution should dilute the solution with extra water.)
The grow environment adjustments have been worth it, Culberson notes, who described the transition “like hitting a greased slide.”
“Our yield and potency improved, and the structure of our flowers was fuller,” he says. “We saw the improved morphology and structure in our plants indicative of a better nutritional profile.”
Without baseline data to compare against and robust data collection capabilities, Culberson would be hard-pressed to make these determinations. Columbia Care uses an anemometer to track wind speed, as good air circulation promotes water evaporation on leaf surfaces, reducing the potential for damaging fungal infections.
“All of these measurements are governing factors on plant performance, driving and indicating whether a plant can or can’t metabolize,” Culberson says. “Watching these metrics keeps plants in a sweet spot of production at all times. We don’t have to guess, or assume like growers used to when sampling a small portion of a grow.”
Working Within The System
Growers acclimating to new lighting systems need to monitor and tweak environmental controls during each production phase, Schimelpfenig says. In the flowering stage, for instance, growers retrofitting from HPS to LED can maintain the same VPD targets but should increase HVAC temperature setpoints by seven or eight degrees to preserve desired VPD.
“That’s because LED fixtures give off less heat,” Schimelpfenig says. “It’s important to take several distinct measurements of leaf temperature across the canopy to accurately reprogram your controls. The temperature adjustment for rooms growing younger cannabis may be different. Because lower-wattage light fixtures do not put off as much heat into the room as fixtures for flowering, when the switch is made to LED, the increase in temperature might be smaller.”
No matter the growth stage, Schimelpfenig suggests placing sensing equipment in an aspirated box shielded from light. Additionally, growers should measure environmental readings in several places to account for microclimates.
“Think about the zones of control that you have, and how you want to get feedback from those zones,” Schimelpfenig says.
Columbia Care has implemented a rolling daily system in checking plant particulars. Culberson says rotating crop measurements give producers insights on cultivating cannabis in various growth conditions, including when fine-tuning parameters during a lighting change.
Most Columbia Care facilities are nine-week turns (corresponding to the duration of each flowering period). Daily data checks provide a pulse of a facility, allowing growers to know if their crop is trending in the right direction.
“We can look at data points and use them as a jumping-off point,” says Culberson. “We’ll dive into the data and get actual photos to make sure we know the issue. For example, show me your oldest mother stock so I can see if the color and structure is right. Or put a pH probe in a pot and take a picture of the reading.”
With temperature and humidity readings being a constantly moving target, it can be challenging for growers to establish consistent growing trends, Schimelpfenig says. Considering the variability of room conditions, RII recommends that growers place sensors covering an average of 500 canopy square feet. However, coverage depends on the purpose of the sensor as well as your crop’s environmental set-up.
Of course, not every cultivator is well-versed on the complex minutiae of every growing metric. Those just starting out can harness integrated systems and analytics software, gleaning a few crucial data points before incorporating this information into standard operating procedures.
“Gain confidence with your data first—become comfortable with using it and confident in its accuracy,” Schimelpfenig says. “Verifying your data is a good idea before you start controlling and automating. Research your existing equipment and its sequence of operations to make sure it orchestrates in harmony.”
Schimelpfenig suggests checking what communication procedures your power and data management systems are using, as more “handshakes” between systems can equate to incompatibly and, eventually, the need for expensive translation protocols.
Back up data regularly both on- and off-site, keeping records for two weeks before replicating them in the cloud or external hard drive. Cloud storage, in particular, protects owners from outage-related data loss or systems going offline.
Ultimately, any step growers take to track data is a good one, remarks Culberson. Even a cheap light meter can assess how your lighting is best used in conjunction with other plant growth metrics.
“A good grower looks at a variable and understands how that impacts all the other variables,” Culberson says. “There’s all sorts of data one needs to look at before they execute on remediation, and that all goes back to the system.”