
Plant phenotyping is a process that growers can apply to assess traits—the outward expression of a plant’s genetic makeup and the environment it grows in. Common traits include height, color, flower yield, photosynthetic efficiency and terpene composition, to name a few. Humans are organic phenotyping machines. We’ve been assessing traits since the dawn of agriculture, collecting seeds from the plants with the highest yield of food or fiber, the highest resistance to stress and disease, or plants with the greatest medicinal potential.
For example, we’ve modified corn from the wild grain teosinte, which had only five to 10 kernels, into the prolific row crop it is today, and likewise with everything else we’ve cultivated. The problem for us has always been waiting for the plant to finish growing to know if we made the right selections and horticultural decisions. It’s a terribly slow process and difficult to predict.
Enter digital phenotyping. This process uses imaging tools to see inside the plant on a microscopic level, revealing critical variables, such as light absorbed or reflected, heat, water flow and the accumulation of pigments. Digital phenotyping allows growers to see not only the plant parts, but also the processes inside the plants as they unfold over the course of development. At its most advanced, digital phenotyping is robotized, using automated conveyance from controlled environments to imaging stations and back again, repeated in daily or weekly cycles, using machine learning to recognize trends over vast data sets.

Predictive Insights Into Yields
But let’s start with a simpler example, one using a handheld device. In a 2017 cannabis fertilizer study by the University of Guelph, researchers collected weekly data points on plant growth, including measurements of chlorophyll content, or “leaf greenness,” with an instrument made by Minolta, a company with a long history in camera development. The meter clamps onto a leaf and determines chlorophyll content in just a few seconds, capable of measuring even small differences in greenness a human eye cannot. It’s not counting molecules, but rather has diodes that emit 660nm (red) light, which chlorophyll absorbs, and diodes that emit 940nm (IR) light, which the pigment doesn’t absorb. The difference between the values provides an accurate estimate of chlorophyll content at that location on the leaf. At the end of the experiment, the researchers noticed a positive correlation between week 5 leaf chlorophyll readings and flower dry weight at harvest. This implies that—weeks away from harvest—yield could be predicted from a reading that takes all of five to 10 seconds to perform!
Finding this sort of early indicator is the holy grail of breeding and production. Imagine if other early indicators allowed even earlier prediction of yield, at week 2 of flowering? In veg? In propagation? Imagine how that would speed up breeding selection or allow a grower to steer a more productive course during cultivation. It’s not out of the realm of possibility. Corn yields in the U.S. increased 15% to 30% in the 1990s due to hybrids with a simple new trait: narrow leaf angle. The more vertical the corn leaves grew, the more light they intercepted across the canopy. Each plant did not necessarily yield more grain, but planting density increased, resulting in higher yields per acre. An inbred named B73 with this leaf angle trait has been used extensively for decades in developing corn hybrid lines.
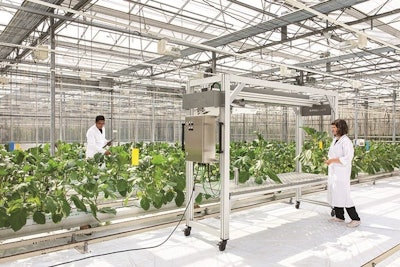
The problem with chlorophyll meters is that chlorophyll can vary depending on where on the leaf the sensor is clamped. Readings of these instruments can vary by the person taking the reading, as well. For robust, accurate data, what is needed are larger, more powerful camera systems (imagers) with larger scanning fields. The Netherlands company Phenospex has a camera system called PlantEye that can move across a greenhouse above the canopy on a gantry, analyzing a full crop. PlantEye has a 3D and multispectral camera that creates 3D models with multispectral information. From this model they gather plant data like plant growth, leaf color, chlorophyll, nitrogen content and healthy vs unhealthy tissue. This data can then be correlated with the grower’s data on flower yield or terpene content at the end of the experiment, to possibly identify early indicators of those harvest traits. “This is feasible for sure,” says Martijn Houben, marketing and communications specialist with Phenospex. “For instance, we measure and quantify leaf greenness, which means you can determine from the results of the University of Guelph study what you need to look for in our parameters and then visualize it in our software.” The company has modified their system to also be used on a mobile grow table, inside a growth chamber or even in the field.
Universities and vendors have created other systems that “bring the camera to the plants,” including ones that are installed on farm equipment and aerial drones. Systems that do the opposite, by bringing the plants to the camera, allow for more sophisticated imaging systems that can’t be easily mobilized.

Types of Imagers to Consider
Imagers vary by the number of wavelengths they use for imaging and whether the wavelengths are visible or not, by whether they assess morphological traits or physiological traits, and by the field of view: whole plant, plant organ, seedling or smaller.
Here is a quick review of these imaging techniques, though this new scientific field is evolving quickly.
Visible light imaging. RGB camera systems measure reflectance of red, green and blue wavelengths of visible light. They can assess morphology such as germination rate, height, leaf angle, growth rate over time and more. Small RGB units assess germination rates in propagation trays and, in a greenhouse production environment, can signal a robotic transplanter to fill empty cells of a tray with a new plant in seconds. Larger units may have top view, side view or both. The Netherlands-based company Aris has an imaging system that grades greenhouse orchids at Green Circle Growers in Oberlin, Ohio, where plants spin past the camera and, in a matter of seconds, their flowers and flowering stems are graded and automatically conveyed to the proper shipping lane or back to the greenhouse for more growth. And they have begun to move into the cannabis industry, reports Dr. Rien den Boer, Aris’ general manager. “We have a camera system in a transplanting machine to sort and phenotype 4- to 6-inch young plants active in Canada and another one on the way,” he says.

Fluorescence imaging. Plants fluoresce when exposed to bright light as way of dealing with excess energy. Though invisible to the human eye, these imagers can detect this glow and use it as a measurement of photosynthetic efficiency (the less fluorescence, the more energy is being used for photosynthesis or heat), allowing plants to be screened for leaf health status. Plants can be evaluated for robustness after being exposed to some form of controlled stress. Lastly, and of great potential value to the cannabis industry, fluorescence imaging can detect disease infection before symptoms are visible to the human eye. Growers could use the information to select young plants based on their resistance to powdery mildew.
Thermal imaging. Plants cool themselves by evaporating water through their leaf stomatal pores. Using surface temperature measurements, thermal imaging can measure water status and stomatal conductance in both normal and controlled drought conditions. Plant selection for drought stress tolerance can lead to improved yields, as even single events of drought stress have been shown to reduce yields of some flower or fruit crops.
Multispectral and hyperspectral imaging. Multispectral measures two or more isolated, non-contiguous wavelengths. (Think of the chlorophyll meter described previously, with its 660nm and 940nm sensors.) Hyperspectral systems measure reflectance of narrow slivers of adjacent wavelengths continuously through the entire visible spectrum and typically beyond it for an extraordinary data set. With the proper computational tools, growers can mine this data for mathematical relationships, or indices, between two or more wavelengths. These indices, such as the Normalized Difference Vegetation Index, were first used with satellite imagery to detect live green vegetation on Earth. They can measure multiple traits simultaneously to assess leaf and canopy health status. They can detect biochemical composition of the plant, such as the amount of plant pigments, and biological processes, including growth rate and the early onset of stress or disease. They even can generate data on previously unmeasurable traits, the undiscovered country.
3D imaging. Laser scanning of plants create depth maps or 3D point clouds to determine shoot biomass, leaf angles and canopy structure. For example, one camera system on the market can move across a greenhouse above the canopy on a gantry, analyzing a full crop. It includes a 3D and multispectral camera that creates 3D models with multispectral information. The model allows growers to correlate the data with flower yield or terpene content to possibly identify early indicators of those harvest traits.
Computerized tomography (CT) imaging. The same computerized tomography that controls the motion of the X-ray source for a 3D image scan, what we call “CAT scans” for medical diagnostics, can be used on plants. It can even image roots and show them separate from the substrate. Purdue University’s Controlled Environment Phenotyping Facility uses this CT tomography for root imaging, along with RGB and hyperspectral imaging.
Magnetic Resonance Imaging. MRIs are useful for providing 3D scans that can be used to measure water content for the creation of water maps of the plant.

Non-Destructive Testing
The power and beauty of digital phenotyping is that it is non-destructive, assessing traits without cutting plants apart to weigh organs or grinding leaves for chemical analysis. Examining roots has been particularly damaging to plants until now. With these imaging systems, the same plants are commonly assessed weekly, sometimes more often, allowing for more than just a snapshot in time. Institutions with large phenotyping centers, such as University of Nebraska-Lincoln, McGill University, Donald Danforth Plant Science Center or at several agricultural corporations, have multiple imaging booths, each with a different kind of camera system, linked to a controlled environment growth room or greenhouse.
Plants are conveyed to the imagers automatically to reduce human contact and, in fact, may spend their full life cycle on RFID-labeled carriers. The robotized conveyors often have weight scales and irrigation nozzles to provide optimum soil moisture content or to induce drought. There may be multiple irrigation lines to provide different nutrient treatments, so their effects on traits may be studied. Likewise, the controlled environment rooms can be programmed for optimum growth or induced stress, as understanding plant response to stress and selecting for more robust lines is key to improving yields. These centers are enormous investments in equipment and personnel, requiring agronomists, mechanics, agricultural engineers and a team of data scientists to sort through terabytes or petabytes of data.
However, there are plenty of low-cost DIY alternatives for companies with a tech-savvy employee or two, using open-access platforms, such as Arduino or Raspberry Pi. Laser scanners from gaming consoles have been modified to measure crop architecture. Ultrasonic distance sensors have been used to measure plant height. An initiative to enhance in-house environmental research communication called Public Lab has many phenotyping projects posted by subscribers.
If DIY is not feasible, other ways to get started would be to contract space in an existing phenotyping center for an initial study or contact a company that sells imaging systems of varying scales and start small.