
A recurring series focusing on plant cultivation by university researchers
Fertility management can be challenging for many crops. To ensure your plants are receiving the fertility they require, a stepwise nutrient monitoring program that examines both systems and plants should be implemented.
When setting up a holistic greenhouse or indoor monitoring program, it is important to monitor and test each step along the supply chain, examining the irrigation pipes and flow of water and nutrients. The main steps include:
- the water source
- the mixing tank and injector
- the drip emitters or delivery system
- the substrate
- the plant.
At each step, complications and challenges can arise. By taking a “pipe-to-plant” approach, you can determine where along the supply chain problems arise and identify them early to prevent costly ramifications to plant growth and development.
1. The Water Source
High alkalinity levels in irrigation water can limit plant growth and cause economic losses for container-grown cannabis producers. High alkalinity can occur in coastal areas or in locations over limestone bedrock. Much of the well water in the Midwest and Great Plains of the U.S., southern Ontario and the prairie provinces of Canada contain excessively high levels of alkalinity.
To ensure your water is within the optimal range, target an endpoint alkalinity of about 2 milliequivalents (mEq) [~122 parts per million (ppm) bicarbonate (HCO3-)]. This will result in a water pH of 6.0 to 6.2. By monitoring and maintaining alkalinity within the above ranges, the water will stay closer to neutral, and it will prevent accumulation of bicarbonates or other toxicities, such as magnesium or calcium.
An online tool called AlkCalc calculates the amount of acid required to neutralize alkalinity and is available at e-gro.org/alkcalc/.
2. The Mixing Tank and Injector
Many operations utilize an injector or mixing system to deliver plant fertility because it reduces the amount of time spent mixing fertilizer solutions and can obtain a more precise dose of fertilizer solution.
Injector systems take a small quantity of a concentrated fertilizer solution and inject it at a known ratio into a quantity of water. So, for example, if the injector calibration is set to 1:100, then it is injecting 1 part fertilizer solution into 99 parts of water.
These units help maintain consistent fertility levels. However, these systems need to be calibrated and monitored to ensure accuracy. The easiest method to check the injector unit calibration is to evaluate the electrical conductivity (EC) of the concentrated solution from your mixing tank and compare it to the recommended EC value provided on the back of the fertilizer bags. You will need to know your injector calibration setting, e.g., 1:100, and fertility rate, e.g., ppm Nitrogen (N).
To do this, you will need a pH and EC meter. More information on these meters and how to use them can be found in “Troubleshoot Cannabis Nutrient Problems Before They Occur” in the August 2019 issue of CBT.
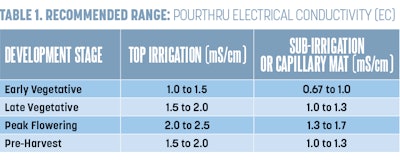
To ensure you have mixed your fertilizer correctly, determine your target EC values for your crops. Table 1 (above) has a breakdown of the target rates based on cannabis life stage. Some operations and cultivars may require higher or lower EC values, but these values should accommodate most if not all scenarios and genetics. Once you know your target EC, check your fertilizer bag to determine the ounces of fertilizer needed per gallon/liter of water to obtain the desired EC value.
Please note that EC values can be higher than the recommended range if your irrigation water has a higher EC value. To test this, use the below equation. This new number will be the recommended range and the one to use to compare to the fertilizer bag calculations.
(EC of Fertilizer Concentrate) – (EC of Irrigation Water) = True EC of Fertilizer Solution
By testing the EC of your fertilizer concentrate, you can ensure that the fertility you are applying is within the recommended ranges and meets your target fertility goals. Any over or under calculation will result in a nutrient toxicity or deficiency, which will negatively impact plant growth and development.
Once you confirm the injector is calibrated and the fertilizer is mixed properly, the next step is to test the delivery system.
3. The Drip Emitter or Delivery System
Once you’ve confirmed that the correct concentration of fertilizer solution is being administered into the irrigation infrastructure, the next step is to determine if the irrigation system is providing the correct volume of fertilizer and water to plants.
Because most nutrients are taken up by the plant when they take up water—this process is called mass flow—the volume of irrigation water supplied will directly impact the fertility a plant can access. If flow is restricted on a line, or if a pump is going bad for a unit, or if there is salt accumulation in the lines, which is restricting flow, less water will be delivered than required.
To ensure there is proper irrigation volume and, consequently, that fertilizer is being applied, periodically conduct a flow test. To conduct a flow test, simply run the irrigation system for a set period and capture the volume of water dispensed and measure it. Say, for example, you have irrigation spikes in your pots. To test the flow per minute, remove an irrigation spike from the pot, and place it into a container. Then, run that irrigation line for a minute and measure the resultant fluid administered. This will be the volume of water per minute the irrigation line will supply to your plants.
Test multiple drip emitters or irrigation delivery apparatuses to get an accurate average for how much irrigation water is being administered.

4. The Substrate
The next testing point along the pipe-to-plant supply chain is the substrate itself. While you may be administering the correct fertilizer concentration and the right volume of fertilizer and water, the substrate itself can complicate and confound proper fertility. Plants must maintain a relatively neutral internal pH (5.8 to 6.2) within their cells. This means that for every additional charged ion they uptake, they must release an ion of opposite charge to maintain their internal pH. For example, if a plant takes up a potassium ion (K+), it has altered the internal fluid charge and pH of that cell. To maintain the neutral charge, the plant must either uptake a negatively charged ion or it must get rid of another positively charged ion to reestablish balance.
If this process is repeated over and over, the pH and ions within the substrate can be altered dramatically. If too many hydrogen ions (H+) are introduced into the container substrate, this can drastically alter the pH, which will in turn impact root growth, nutrient availability and nutrient uptake rate.
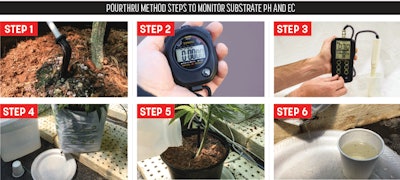
To monitor substrate pH and EC, we recommend using the PourThru method. A summary of the steps required to conduct a PourThru analysis can be found in Figures 1 to 6.
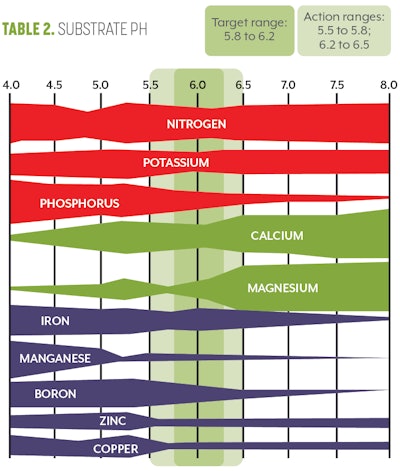
Once you have determined the plants’ substrate pH and EC, you can then compare your values to the optimal values for cannabis. (Refer Table 1 for EC and Table 2 for pH (above) for optimal target ranges. For further instructions on how to correct pH or EC, read “New Research Results: Optimal pH for Cannabis” in CBT’s March 2019 issue and “How to Diagnose and Correct High Electrical Conductivity (EC) in Cannabis” in the July 2020 issue.
5. The Plant
The final stage of monitoring in the supply chain is the plant itself.
Up to this point, you have ensured the irrigation water is close to neutral, the fertilizer is mixed to the appropriate concentration, the injector is providing the right amount of fertilizer concentrate, the irrigation system is providing enough water and fertilizer to pots, and the substrate has an optimal pH and EC. The last step is to test leaf tissue to ensure the plant is taking up the right amount of nutrients.
To obtain an accurate picture of the nutrients being taken up and utilized within the plant, leaf tissue should be removed and sent to a laboratory for testing. Leaves at different stages of development (older, mature, new) will have different nutrient concentrations. For example, older leaves typically have fewer nutrients due to the nutrients being reallocated to areas where they are needed more and because of the dilution effect in larger leaves.
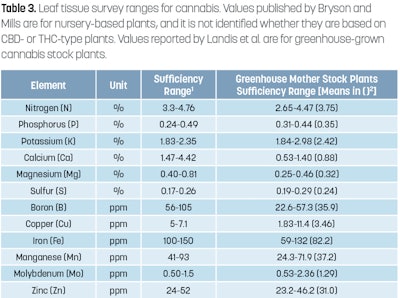
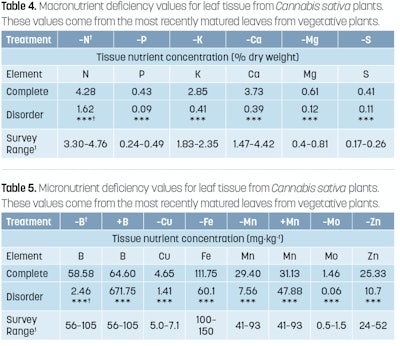
To get a clear picture of what nutrients and in what quantities plants are able to obtain, the most recently mature leaves should be sampled. In the article “Routine vs. Diagnostic Leaf Tissue Analysis for Cannabis,” published in CBT’s November 2019 issue, we went into great detail on how to sample, obtain, and interpret leaf tissue values. Refer to Figures 7 to 10 (above) and Table 3 (also above) for more information on sampling protocol and interpretation of sampling results. For critical deficiency values, refer to Tables 4 and 5 below.
Conclusion
Testing these points along the supply chain—from pipes to plants—will allow you to monitor your entire irrigation and fertility program. By doing so, you will make sure your operation runs smoothly and costly mistakes are detected early before they hurt your bottom line.


