
Investors need to know that workflow is a critical input into facility design that affects the business case of an operation—and if the workflow is sound, the business most likely is as well.
The hardest question in the industry remains: How much yield potential can a well-designed and well-managed operation deliver? Investors want to know how valid a pro forma is. (A pro forma is a method of calculating financial results that focuses on the anticipated result of a transaction, according to Investopedia.) Cultivators measure yield in a variety of ways, but we recommend: pounds of product delivered annually per square foot of flower canopy area. This and other similar metrics reflect all the effects that design and practices have on yield, including workflow.
Discussions with numerous growers suggest that 0.1 pound of dried product per square foot of flower canopy represents very good performance for a flower producer. At the 0.1 level, a 1,500-square-foot room would have the potential to deliver 150 pounds per turn. Our client experience across a sustained basis is that even with high-performing growers, 0.1 is a stretch. It may be wise to set expectations lower, between 0.05 and 0.08. We have seen those levels achieved and would recommend using such values in a pro forma, especially for the first year of operation. But be sure to take these numbers with a grain of salt because they are, as noted, not standardized. We hope they will seed discussions that will eventually produce an accepted standard for the industry.
Yield expectation is half of the financial picture; market price is the other. The best yield can’t overcome low prices in the market-so whatever the design, the financials must meet expectations even when using worst-case projections. If they don’t, it’s back to square one. With prices on the decline in most markets, it’s worth a hard look at where leadership thinks prices will go and what that means for the facility’s profitability.
Layouts and Flows
Yield potential is largely determined by flower canopy area alone; but how well those expectations will be met and how costs are kept in check is largely dependent on how well the workflow is executed. Many investors will want to confirm that workflow is well-documented and detailed, so that adds to a cultivator’s reasons for implementing and documenting efficient workflow processes. To that end, below you will find several sample workflows for reference.
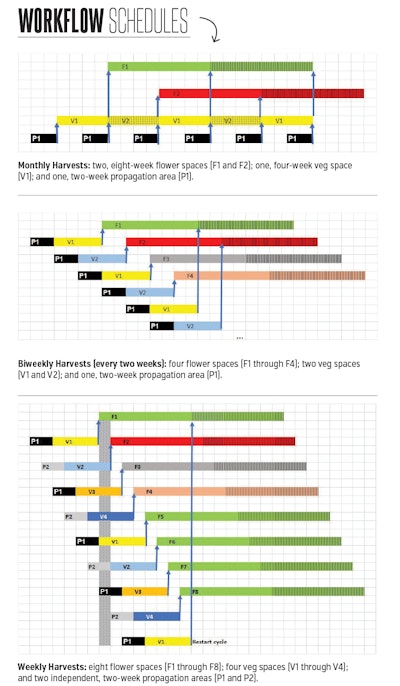
These examples show workflows that deliver harvests monthly, biweekly and weekly by shifting plants from propagation rooms (“P” in the charts at right) into veg rooms (“V”) and into flower rooms (“F”); as the propagation room is emptied, it is filled for the next cycle. We suggest designers start with these examples and play with the flows. There is one rule: Every space needs to be cleared of plants and sanitized before that space can be reloaded with the next wave of plants.
Add Activity
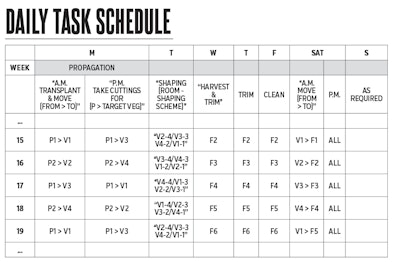
With a weekly harvest schedule, every cultivation step involved in growing eventually happens every week. Keep in mind there is an order to things (for example, each space being emptied before it can be filled), and then look down the chart for that week. An empty F1 is loaded from V1 this week, V1 is reloaded from P1, P1 is refilled with new cuttings.
F2 must be harvested this week so it can be ready to be reloaded the next week, and new cuttings need to be taken so V3 will have plants ready for loading in two weeks. Shaping and pest management actions are other cultivation activities that should also be included on the schedule, which when reduced to written form may look something like the example on the opposite page.
The designer still must decide how to orchestrate the activities planned for each day, including ensuring that sufficient labor is available. Weekly harvest flows have essentially constant labor demands, while monthly harvest systems have a monthly labor-demand bubble.
The Sweet Spot
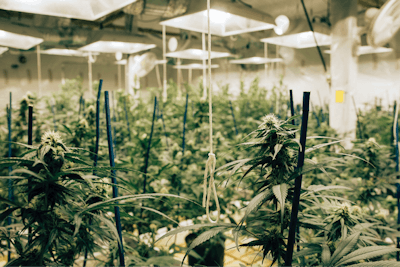
These examples are based on eight-week flowering periods, but this graphical layout and scheduling can be performed for any flowering period. If growers want to flower plants on a nine-week schedule and do weekly harvests, they need nine flower spaces to make that work. Likewise, a weekly harvest on a seven-week flower schedule requires seven spaces, so cultivators need to think about their strains and flowering schedules before the design can be locked down. If growers grow to more than one schedule, they may be committing to having separate production lines and infrastructure for each.
It is up to the grower to decide how long plants and specific strains need to be flowered, but we will offer some insight into what happens to revenue when we play with flowering schedule, based on what we’ve seen.
Eight weeks is a commonly used flower period for indicas and hybrids. We use it as an estimating “stake in the ground,” and we set the yield potential from eight-week plants as 1.00 as a baseline yield for comparison. Plants that grow for less than eight weeks produce less, and plants grown longer produce more.
Eight-week indica/hybrid crops deliver six complete turns in a year (52 weeks in a year ÷ 8-week flower period = 6.5 cycles per year), and with the yield expectation of 1.0, the annual yield potential is 6.0 (6 turns x 1.00 as baseline yield per harvest = 6.00 annual yield potential).
Flowering for seven weeks allows for seven complete turns in a year, as opposed to six for an eight-week schedule (52 weeks in a year ÷ 7-week flower period = 7.4 cycles per year), and the hope is that a seven-week crop can deliver more yield annually. However, those seven turns will all be at a reduced yield per turn. If we assume seven-week crops deliver 90 percent of the yield of an eight-week crop, seven turns gives an annual potential of 6.3 (7 turns x 0.9 potential yield per harvest = 6.3 annual yield potential), just above the 6.0 potential of eight-week crops. That doesn’t look like a lot of leverage to us, but it is a tool for cultivators to consider.
Crops with nine-week flower periods generally cost more in infrastructure because they require an extra week of growing, which also limits cultivators to five complete turns annually (52 weeks in a year ÷ 9-week flower period = 5.7 cycles per year). If we assume the yield potential for these nine-week crops is 15-percent more (so 1.15 vs. 1.0) than eight-week crops, the annual yield potential is 5.75 (5 turns x 1.15 potential per harvest = 5.75 annual yield potential), which is less than the yield for eight-week crops. Nine-week plants (with 5 annual turns) need to deliver 20 percent more yield (so 1.2 vs. 1.0) in the extra week just to keep pace with eight-week crops (5 turns x 1.20 potential per harvest = 6.00 annual potential). Only if those strains can be coaxed to deliver 30-percent more yield (1.3 vs. 1.0) in the extra week does growing longer seem to make sense (5 turns x 1.30 potential per harvest = 6.50 annual potential). Obtaining a 30-percent increase in yield is more than a stretch, however, and when we add another week’s worth of growing costs for a nine-week flower period, the decision to take what can be achieved in eight weeks looks pretty reasonable.
How Many Plants?
The workflow examples shown above do not speak to plant counts. A weekly harvest can be obtained from eight separate greenhouse ranges or a single flower space whose F1, F2 … F8 spaces each take one eighth of the available flower space. The number of plants used to fill those spaces is what differs between those layout changes-and the count, along with the size of the plants, determines how many propagation and veg spaces there must be, as well as how large they must be.
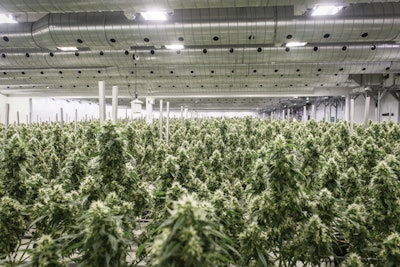
Yield is tied to canopy surface area, which can be produced from many smaller plants, or from fewer plants that need to be vegged longer. The grower is free to find the best way to develop his or her canopy, but we will offer an observation that 2- to 3-foot high plants shaped to have four to six co-dominant mainstems can produce a solid canopy with one or more top buds every 6 inches. These will top out at a very manageable 6-feet in height. These plants can be vegged in three weeks, depending on nutrient and light conditions in veg. If those buds grow to an eighth of an ounce when dry, that is an eighth of an ounce every 36 square inches (.25 square feet). In other words, a 1,000-square-foot canopy would deliver 4,000 buds, or 31 pounds of dried flower. This small-plant approach requires a lot of plants to build the canopy, but it is a proven technique that we have seen deliver yield metrics of 0.08 pounds per square foot of flower floor space.
Investors may expect workflows to be documented along these lines, and if they aren’t, it suggests that the designer needs to better demonstrate his or her understanding of the flows for an investor to sign off on any pro forma. The structure shown here gives no guarantee for success, but it does remove communication errors, sets expectations and clearly conveys the details necessary to eliminate mistakes, and that translates into optimal performance and financial results.


