
Plants, much like humans, require certain nutrients and minerals to thrive. These macro- and micronutrients help plants grow properly, obtain optimal yields, and complete their lifecycle. Aside from nitrogen (N), phosphorus is perhaps the most important of the macronutrients. Phosphorus (P) is essential for energy storage and utilization, root development and growth, flower formation, and metabolic activities in cannabis.
In plants, P is a mobile element that is necessary for many key metabolic processes, in addition to cell elongation and root growth and development. Therefore, P can be moved (translocated) from older growth segments of plants to satisfy demand in newer, developing plant portions. This is important to note, given that nutrient deficiency symptoms will appear in older leaves as the plant moves P resources into the new and developing leaves and other sinks such as developing flower buds.


Deficiency Symptoms
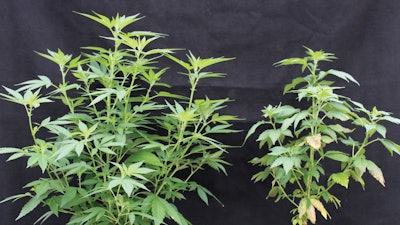
In earlier studies conducted at North Carolina State University (NCSU), researchers induced nutrient disorders in cannabis to examine how plants respond to various deficiencies. Those studies showed that symptoms of P deficiency will develop quickly in cannabis plants, especially during the mid-vegetative portion of the growth cycle and during the flowering stage. Plants first will appear stunted and develop more slowly compared to a healthy plant (Fig. 1). If the plant does not receive P, the older and/or lower leaves will develop olive-green spots in an irregular spotting pattern along the leaflet and margin (Fig. 2 & Fig. 3). As symptoms progress, the olive-green spots develop into larger olive-green spots that appear sunken and almost wet with some necrosis, or burning along the leaf margin (Fig. 3). In advanced symptoms, the yellowing leaves become severely olive spotted with large areas showing symptoms, and in severe cases, large necrotic portions develop (Fig. 4 & Fig. 5).

Phosphorus Fertility Rates
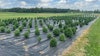
In a second research study, NCSU researchers looked at six rates for phosphorus fertility (3.75, 7.5, 11.25, 15, 22.5, and 30 parts per million (ppm) P). We explored the impacts of fertility rates on above-ground shoots, (i.e. leaf, stems) and below-ground roots, leaf tissue nutrient accumulation, total bud fresh weight, and cannabinoids.
For optimization of biomass production, a minimum concentration of 11.25 ppm P rate should be used for plants grown for flower buds. For mother stock plants, the rate may need to be slightly greater given that nutrient resources will be removed when each subsequent cutting is harvested. Additionally, researchers did not observe significant differences in root biomass production at any level of P fertility. This may largely be due to the fact that when plants are grown in a fixed substrate volume (within a container), they are limited in the amount of root growth and, consequently, more resources will be allocated to shoot growth.

Leaf Tissue Concentration. The rate of P fertility that accumulated in leaf tissue was not maxed out in this experiment. This is not surprising given the high levels of P fertility many cannabis growers provide plants. The highest P concentration (% dry mass) occurred with the 30 ppm P rate. This rate resulted in almost double the leaf tissue P as the lowest rate of 3.75 ppm. When plants take up extra nutrients but yield does not increase, it is defined as “luxury uptake.” Plants will take up the extra P if provided, but because flower yield did not increase, providing this extra P does not make economic sense.
Flower Buds. For sampling purposes, the shoot apical cola bud, three terminal axillary buds, and three interior branch nodal buds were sampled. The combined buds were pooled together to produce a sub-sample of buds and their fresh weights recorded at the time of harvest. The bud weights indicated that a fertility rate of 22.5 ppm P resulted in a significantly larger bud fresh weight, and almost doubled the fresh weights of the lowest two concentrations (3.75 and 7.5 ppm P).
When cannabinoids were analyzed, no increase in cannabinoid concentration occurred above the 11.25 ppm P concentration for the acid pools (CBDA, CBGA, THCA, total THC, total CBD, and total cannabinoids). Results varied for the active cannabinoids (decarboxylated cannabinoid pools) and thus are not highlighted here. More detailed results and data can be found in our recently published scientific journal article, “Impact of phosphorus on Cannabis sativa reproduction, cannabinoids, and terpenes,” noted in the sidebar. These data may indicate that a constant level of P fertility provided at 11.25 to 15 ppm P may be adequate to optimize cannabinoid production within the floral material (Graph 1).
Plants in this study received a constant feed fertility, and researchers did not alter P fertility based on growth stages, as is common in the industry. More research is needed to elucidate the impacts varying P fertility can have on cannabinoids. For these results, however, if a constant feed fertility is used, we would recommend a 15 ppm P concentration be provided, as this is above the threshold seen at 11.25 and would provide an extra fertility buffer to ensure maximum flower bud dry weight and cannabinoid production. This fertility level (15 ppm P) will allow for error and alterations given that different cultivars show varied architectural structures and may vary slightly in nutritive needs. More research also is needed to identify if cultivar variability exists due to plant architecture and bud types (Fig. 6).


Conclusions
A general recommendation of 11.25 ppm P for vegetative production appeared to be adequate, though P rates would need to increase as plants increase in size and age. For bud production, a P rate of 11.25 to 30 ppm P produced a similar amount of fresh bud biomass. For optimizing cannabinoid production, no increase in cannabinoid concentrations occurred above the 11.25 ppm P fertility rate. This indicates that in a constant feed fertility system, adding additional P resources above 11.25 may not increase cannabinoid production. The next steps in scientific inquiry would be to compare the constant feed fertility results against a program or programs that alter P fertility based on life stages. Additionally, species or type specific research is needed as different architectures, flowering shape and distribution, and cannabinoid profiles exist within Cannabis sativa.