Edibles had a superb 2016, with sales of $281.7 million in both channels (medical and adult-use) in Colorado, Washington and Oregon. The category was hefty to begin with during 2015, yet it still managed to grow by 61.5 percent during the following 12 months.
Between all of these states and channels, two categories garnered more than 60 percent of the market: candy and chocolates. Last year, candy captured 42 percent of the market, and consumers spent enough on chocolate to maintain a 20-percent market share. Among all subcategories, gummies (which fall into the candy category) were the leaders, making up 20 percent of all edibles sales.
The edibles category achieved its most dramatic consumer boost in Washington, where growth during both Q1 ($12.3 million in sales) and Q4 ($18.2 million in sales) was above 100 percent compared to the same period in 2015.
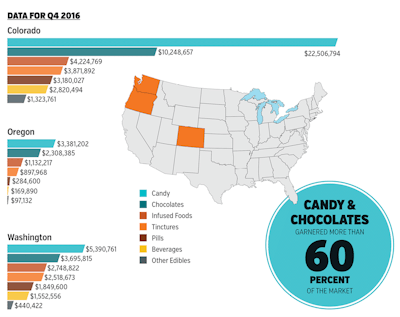
But the fight for category supremacy in each state differs from the average among all states.
In Colorado, we see a rather dramatic difference in growth. In Q1 (with $36.2 million in sales), year-to-year growth in edibles measured 29.9 percent, and in Q4 (sales of $48.1 million) growth in the edibles category expanded by 51.6 percent over the same period in 2015.
By Q4 in Colorado, the edibles market breakdown was:
- Candy: 47 percent
- Chocolates: 21 percent
- Infused foods: 9 percent
- Tinctures: 8 percent
- Pills: 7 percent and
- Beverages: 6 percent.
("Other" products round out the total.)
In Oregon, we are not able to examine adult-use growth: Dispensaries in the Beaver State could not sell products other than flower to adult-use consumers until June 2016. In addition, the launch of adult-use sales in June drew away from medical sales.
We can, however, examine consumer preferences for Oregon during the course of 2016.
In Q1 in Oregon, candy captured 45 percent of sales. Tinctures were in second place with 16 percent, and chocolate grabbed 13 percent.
By the last quarter of 2016, however, consumer preferences in Oregon had evolved rather dramatically: Candy fell to 41 percent of the market, and chocolate rocketed to 28 percent, the highest market share for chocolate among all three states.
With the widest array of products in the cannabis marketplace, the world of edibles is the most dynamic. New products in different categories create fresh consumers, some of whom might pivot from a preference for one product, like a bag of chocolate pieces, to another, like a new high-CBD tincture.
When we examine 2017 this time next year, chances are market shares for different categories and subcategories will have changed. But growth? That should not present any surprises—it will be up, up, up.

