According to BDS Analytics, cannabis beverage sales reached $37 million from January 2018 to November 2018, less than 1 percent of the $4.3 billion in combined sales generated by California, Oregon and Colorado. That market segment’s potential is undeniable, but it poses no threat to big categories such as flower and concentrates, at least for now.
Growth during the period, however, was strong at 41.5 percent. By comparison, flower sales dropped by more than 11 percent during the same period.
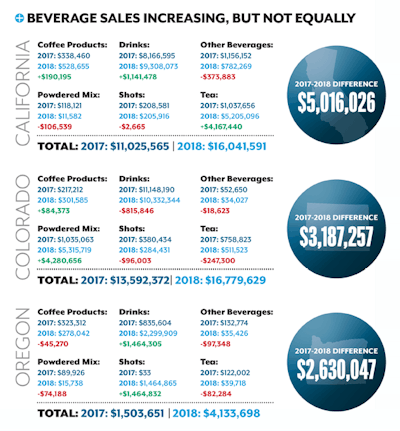
Cannabis “drinks,” which consist of pre-bottled beverages such as sodas, lemonades and fruit drinks, capture the bulk of the beverage market share, with 59 percent of total beverage sales across California, Oregon and Colorado. Non-bottled tea (loose-leaf, bags) takes second place, making up 16 percent of beverage sales; powdered mixes come in third with 14 percent; and shots and coffee products round out the top-five best sellers with 5 percent and 3 percent of sales, respectively. The average retail price for a cannabis beverage was $14.43.
While “drinks” won the No. 1 spot in total beverage sales during 2018, the product category’s growth was 9 percent, an anemic figure by cannabis industry standards. Meanwhile, overall growth was stratospheric for powdered mixes (300 percent), and robust for shots (232 percent) and tea (200 percent).
This captures the collective cannabis market for these three states. Let’s now scrutinize cannabis beverage trends and sales within each of them individually.
California
In all states, beverages fall within the broader edibles category, which includes brownies, tinctures, pills, chocolate bars, gummies and more. In California, beverages captured 4 percent of the edibles market from January 2018 through November 2018. During that same period, beverage sales grew 53 percent from $972,000 to $1.49 million. (One caveat: comparing sales in California during 2018 with 2017 sales is problematic, as the market was utterly transformed during last year’s transition to legalizing adult-use sales.)
As with all three states, “drinks” win market share. But tea is twice as popular in California as it is across those other two markets, making up 32 percent of sales. Coffee products and shots keep with broader market trends, however, garnering less than 4 percent of all edibles sales between them.
High-CBD tea products experienced the biggest growth at 176 percent between January and November. In general, the high-CBD market performed well in California, with 72 percent growth.
Colorado
Colorado was first to begin adult-use cannabis sales in the U.S. As such, consumer trends there are generally more stable than in other states. That proves true with beverages, where growth was a healthy 23 percent compared to the same period in 2017 (January to November). Where beverages account for merely 4 percent of the edibles market in California, they command 8 percent in Colorado.
Again, “drinks” rule. In Colorado the No. 2 most popular beverage is water-soluble powdered mixes, which captured 32 percent of the beverage market share last year, compared to 62 percent for “drinks.” Tea only grabs 3 percent of Colorado’s edibles market.
Similar to California, high-CBD beverages performed well in Colorado with 585 percent year-over-year growth during the same period.
Oregon
Oregon’s cannabis consumers drove the fast-paced 175 percent growth of beverages during the January 2018 to November 2018 period. Yet sales of beverages are still only a 5-percent sliver of the broader edibles market.
After “drinks,” Oregonians loved shots enough for the beverages to garner 35 percent of the beverage market during the period. Sales data reveals that shots essentially did not exist last year, while this year they most definitely do, thus skewing the category’s growth data.
One principal take-away from reviewing beverage data across 2018—form factors outside of drinks are on the rise. Growth for products sold in bottles was relatively weak, at 9 percent. Meanwhile, less bulky options—powders sold in tiny packets, tea bags and petite vials holding enough liquid for a quick shot—clearly are on the move. “Drinks” may continue to win first place in beverage market share by the end of 2019, but data predicts their dominance will continue to diminish.

