
Timing is tricky business in hemp and cannabis field farming. Plant too early, and farmers risk losing their crops to frost. Plant too late, and growers chance early maturation with suboptimal yields.
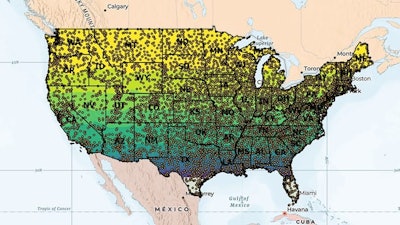
It’s the reason The Hemp Mine, a hemp genetics and cannabidiol (CBD) company, created a virtual planting map to help growers make informed decisions about planting, testing and harvesting.
The map includes data points on average frost potential and daylength at different dates for nearly every county throughout the U.S. With this simple data, hemp and cannabis growers can not only make informed decisions about when to plant, which genetics to choose and when to start testing—they can also track their production schedule nearly down to the day.

But before delving into the map, it’s important for growers to understand photoperiodism.
READ MORE: How the Justice Family Transitioned Into Hemp
Photoperiod Primer
Cannabis and hemp are traditionally photoperiodic, meaning a certain amount of time in darkness will trigger them to flower. The number of hours needed in darkness, otherwise called a flowering response time, varies among different varieties. (This is not the case for autoflowering varieties, which will flower after a certain amount of time regardless of day and night length.)
Travis Higginbotham, an owner of The Hemp Mine, explains that cannabis falls into the short-day plant category, meaning it flowers when the night lengths meet or exceed its flowering response time—in other words, it needs long days followed by short days.

“This transition from a long day to a short day initiates flowering and causes the plant to go from vegetative growth to reproductive growth,” Higginbotham says.
Each breeder should provide the specific flowering response time of a variety down to the minute. (If not, Higginbotham suggests asking. This information is crucial.)
A variety’s flowering response time comes into play heavily when looking at The Hemp Mine’s data map.
Using The Map to Decide When to Plant
Using data from The Hemp Mine’s map, farmers can decide the best time to plant based on their genetics. This consists of a delicate balancing act between frost dates, daylength and how long growers want their crop to remain in a vegetative state.
“In the field, you don’t have the ability to manipulate lighting like you do in a greenhouse or an indoor environment, so you have to strategically plan your production outdoors so that you maximize the environment at the location where you are,” Higginbotham says.
First, farmers should look at frost potential. (This is indicated on The Hemp Mine’s map as DATEPERCENTAGE: For example, DATE10% on 5/22 would mean there is a 10% chance of frost on May 22.)
Farmers need to keep this in mind as they then examine day length. (This is indicated on the map in relation to frost potential as DLPERCENTAGE: For example, DL10% of 14.68 would mean on the same date that the frost potential is 10%, the day length is 14.68 hours.)
Higginbotham explains that farmers should only plant when potential for frost is low and when daylength is above that flowering response time. This protects the plant while allowing it to remain in a vegetative state in its early stages so it can bulk up and ultimately prepare to burst with buds.
Farmers should look at one more data point before they decide when to plant, Higginbotham says: the date when the day length does meet that flowering response time. (This information is not available on the map but is easily found through an online search.) This will determine how long the crop remains in a vegetative state and exactly when it will begin to flower. The longer a hemp or cannabis crop remains in its vegetative state, the more yield it will ultimately produce.
As an example, The Hemp Mine’s Southern Cat Daddy cultivar has a flowering response time of 14 hours. This means farmers growing that variety should choose to plant it when the day length is longer than 14 hours. Also, farmers working with that variety should examine when the day length dips beneath 14 hours to know when it will start flowering.
Other Uses
Using these data points on frost potential and daylength, farmers can determine a plethora of other key factors to drive decisions.
This information can help farmers choose genetics, as day lengths vary throughout the country. To maximize yield, farmers should choose genetics that allow their crop to stay in a vegetative state long enough to bulk the plant to the yields they’re aiming for. This can ultimately be determined through trial and error, but several weeks in a vegetative state serves as a rough benchmark for beginner growers.
“Ultimately what dictates the yield per plant outdoors is the length of vegetative growth and light accumulation during flowering,” Higginbotham says.
Frost potential and day length can also help farmers determine when to begin testing their crop, as they can pinpoint the exact day the crop will start flowering. Higginbotham recommends hemp growers specifically test their crops several times throughout the flowering stage to remain in compliance with the 0.3% THC limit, which will also ultimately determine when they harvest.
And, while much of this data focuses on hemp flowering, Higginbotham says this data can also be useful to hemp farmers growing photoperiodic grain and fiber varieties as well.
“This little piece of data is really something that can help any [cannabis] grower or breeder,” Higginbotham says. “It truly allows you to put a day-by-day schedule on paper.”
The Hemp Mine has a video further detailing photoperiodism and how to use the map here.